
During the 1980s, there were large swings in the spread between the 2-year Treasury note and the federal funds rate due to slowly declining inflation expectations. But this spread averaged 15 basis points in the 1980s. In the 1990s, the spread rose to plus 62 basis points.
The spread between the 2-year note and the federal funds rate averaged 33 basis points from 2000 to 2011. The average spread fell 18 basis points from 2010 to 2011 to plus 34 basis points.
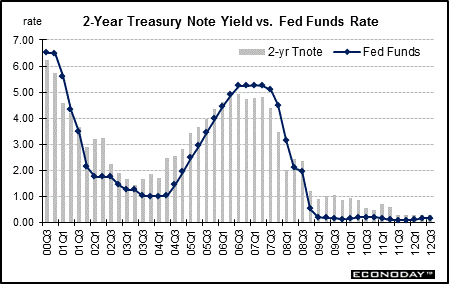
Over the last decade, economic concerns have changed dramatically. Before 2003, investors were still concerned about the state of the economy coming out of recession. However, economic conditions improved and bond investors began to expect the Federal Reserve to raise its fed funds rate target from the historically low level of 1 percent. As the Fed refrained from raising its target rate in 2003 and early 2004, investors were becoming more and more convinced that they would eventually increase this rate and yields on the 2-year note surpassed the funds rate target by an increasing margin in 2003 and 2004. By 2005, bond investors were no longer looking for increases to continue indefinitely and the rate differential began to subside and eventually turned negative in 2006 as investors began to think in terms of the Fed easing in the near future.
However, a rebound in core inflation early in 2007 kept the Fed on hold initially but an easing in core inflation at mid-year and the subprime credit crunch tipped the balance for the Fed to begin easing on September 18, 2007 and through late 2008.
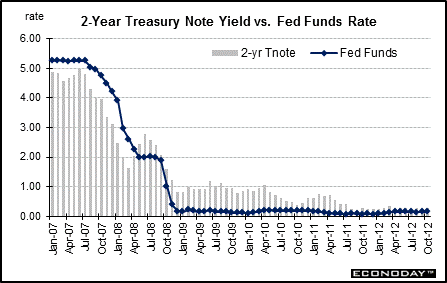
Recession fears led the Fed to cut its policy rate in 2007 and 2008. A weak economy and flight to safety pulled the 2-year yield down and it remained low into early 2011 despite a mild economic recovery. The 2-year note has been a favorite of many during flight to safety. But what pulled the rate down at mid-2011 was the Fed’s announcement on August 9, 2011 that it would keep the fed funds rate exceptionally low at least until mid-2013. And the Fed extended that guidance to mid-2015 at the September 12-13, 2012 FOMC meeting. Given that the Fed would only gradually boost fed funds even after 2015, the 2-year note now is acting like a T-bill. The two-year note stood at 0.28 percent in October—up 2 basis points from September.
Values shown reflect monthly averages.

About the Bond Market • Bond Market Charts • Treasury Market Charts • Treasury Auctions
|